Energy Manager

The Energy Manager object in Thinknx allows the creation of a complete system for monitoring and managing energy flows within the installation.
This includes data collection from different sources, such as grid, photovoltaic production, storage and loads, their graphic visualization and the processing of historical and real-time statistics.
Within the project, the Energy Manager is configured on two distinct but complementary levels:
- Graphic interface, within the Proline section.
- System object, within the System tab.
This separation reflects the structure of the Configurator, where the Proline section manages visualization, while the System tab collects and organizes data and logics.
Graphic Interface

The representation of energy flows is created through a dedicated page within the following structure:
Proline → Function → Page → Flow Management
On this page, the energy management graphic object is inserted, allowing dynamic visualization of:
- Flows between grid, home, production and storage.
- Real-time consumption.
- Historical trends through charts.
The Configurator allows a high level of interface customization, both from a functional and graphic point of view, making it possible to adapt the visualization to the needs of the installation and of the final user.
System Object
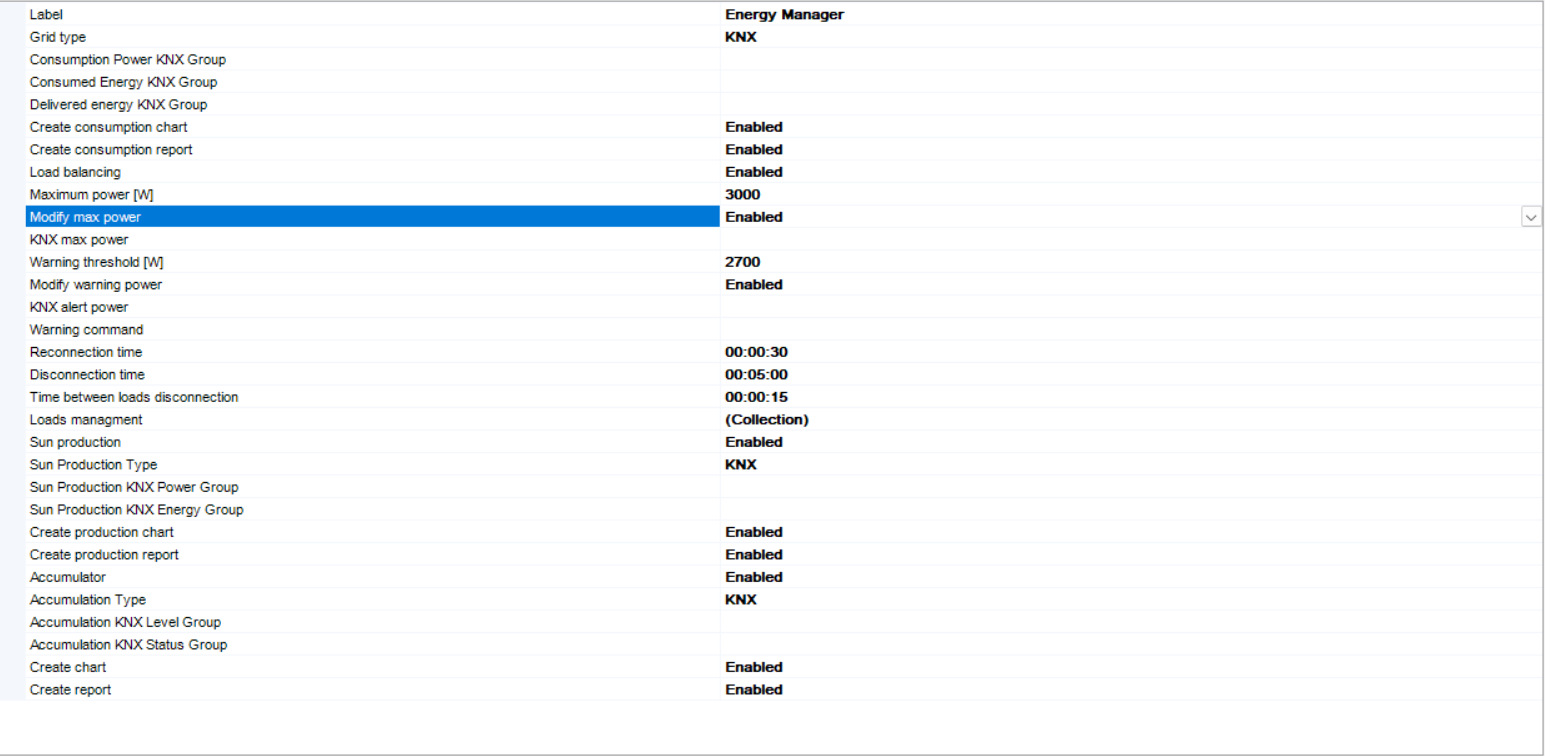
The Energy Manager is added in the System tab as a dedicated object. From here, all data sources and energy parameters are defined.
This object collects information from different protocols and devices, aggregating it into a single coherent system.
In particular, it supports integration with:
- KNX bus
- Modbus devices
- MQTT systems
- Gewiss
The structure is designed to be multi-protocol and interoperable, allowing unified management even for heterogeneous systems.
Grid Configuration

The grid section represents the interface point with the electrical grid.
In this phase, the main parameters are defined:
- Consumed power.
- Consumed energy.
- Delivered or exported energy.
Depending on the selected protocol, it will be necessary to associate:
- Group addresses, in the case of KNX.
- Registers or endpoints, in the case of Modbus or MQTT.
This data forms the basis for generating energy charts and calculating flows.
Load Management
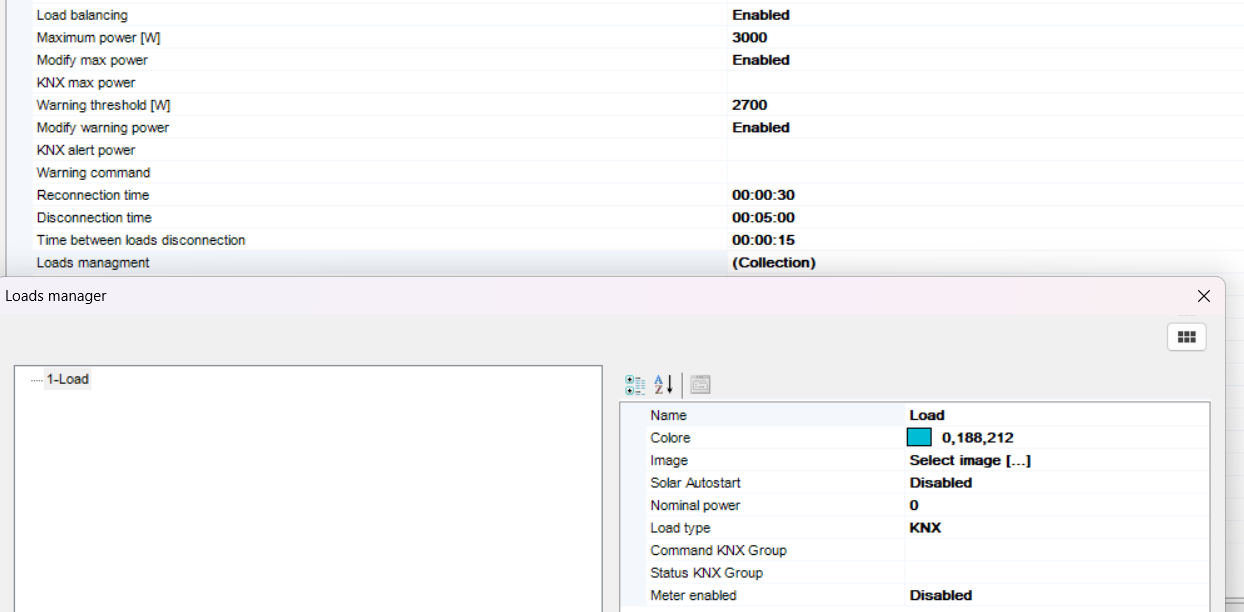
The Energy Manager allows loads to be modeled as individually managed devices.
Each load can be configured with:
- Custom RGB color for visualization.
- Representative icon or image.
- Nominal power.
- Integration protocol, for example KNX, Modbus, MQTT or Gewiss.
- Addresses or registers for control.
Direct metering can also be enabled, associating consumption data with the individual load.
One of the most relevant functions is load balancing, which allows load control to be managed directly on the user side, avoiding the disconnection of the main line.
The system allows load disconnection priorities to be defined in case the limits configured within the project are exceeded.
Solar Production

Energy production can be integrated either through standard protocols or through specific inverters.
In the case of KNX or Modbus, it is sufficient to associate the data through addresses or registers.
For dedicated inverters such as:
- Fronius
- SMA
- SolarEdge
communication parameters such as IP address and port must be configured.
In the specific case of Fronius, both proprietary APIs and Modbus communication can be used, possibly subject to licensing.
Storage System

The Energy Manager also supports storage systems, such as batteries, which can be integrated through KNX or Modbus.
This section allows the monitoring of:
- State of charge.
- Stored energy.
- Charging and discharging flows.
The integration of storage, together with solar production and loads, allows complete energy management focused on self-consumption optimization.
Energy dashboard
The Energy Manager provides a graphical dashboard to display the energy flow of the system.
The dashboard allows the user to monitor production, consumption, grid exchange, battery status and configured loads through dedicated views.
The main available sections are:
- Home: shows a general overview of the system energy flows.
- Solar: shows photovoltaic production data and how the produced energy is distributed.
- Grid: shows the energy imported from the grid and the energy exported to the grid.
- Battery: shows battery charge and discharge data.
- Loads: shows the consumption of the configured loads.
Each section can be displayed using different time ranges:
- Now
- Day
- Week
- Month
- Year
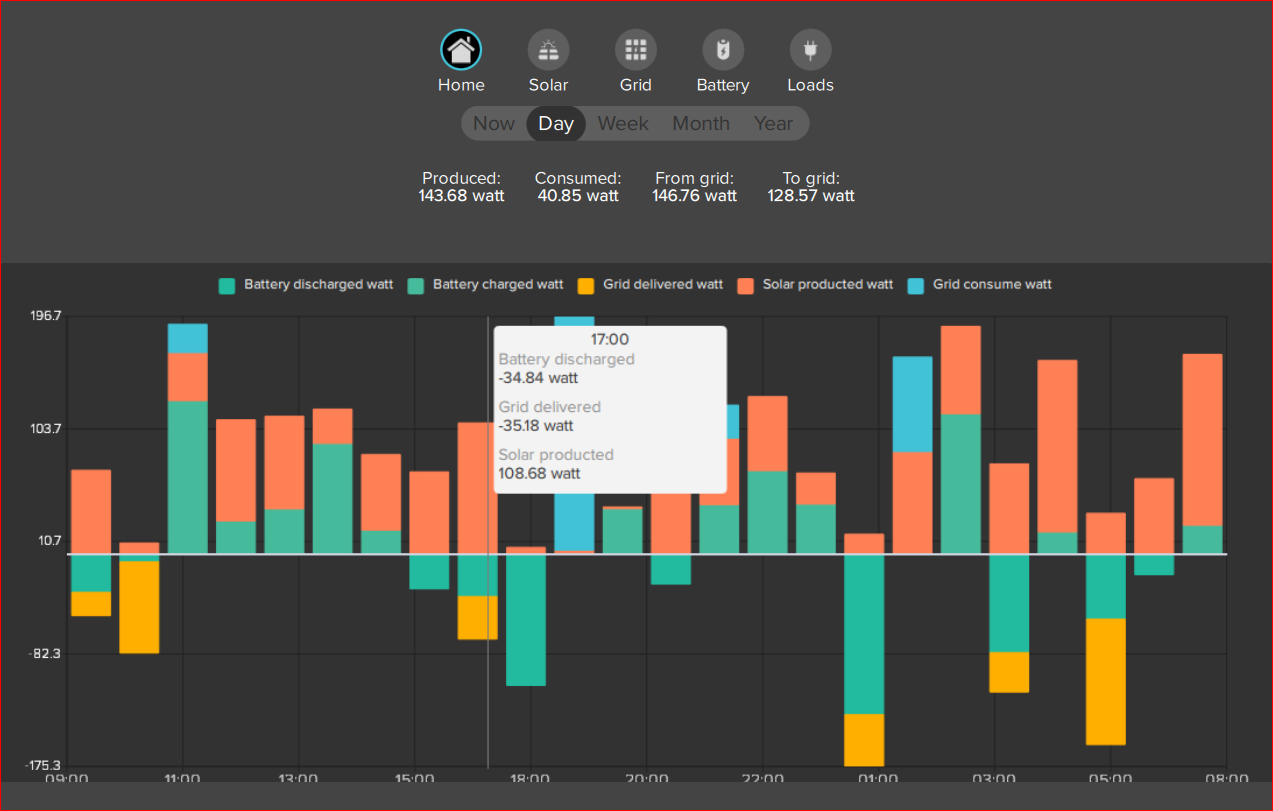
Energy Manager - Home overview
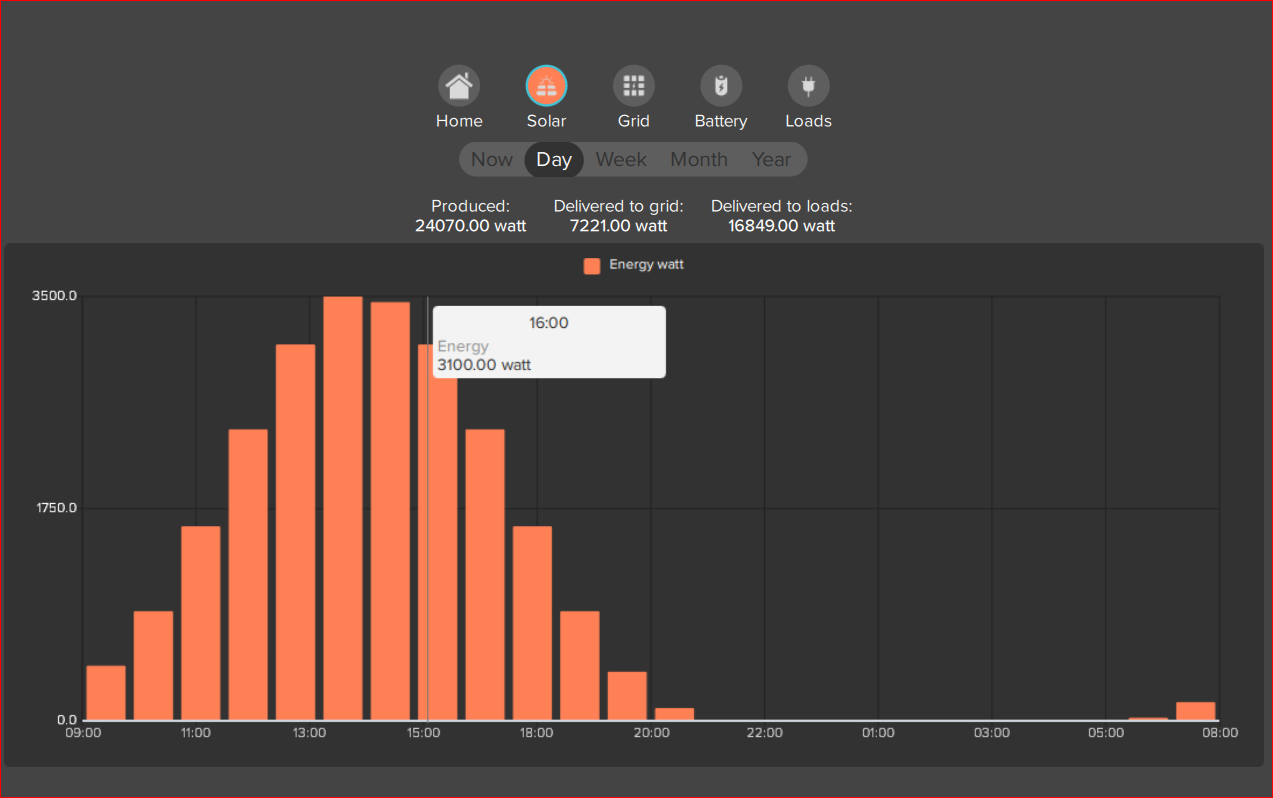
Energy Manager - Solar production
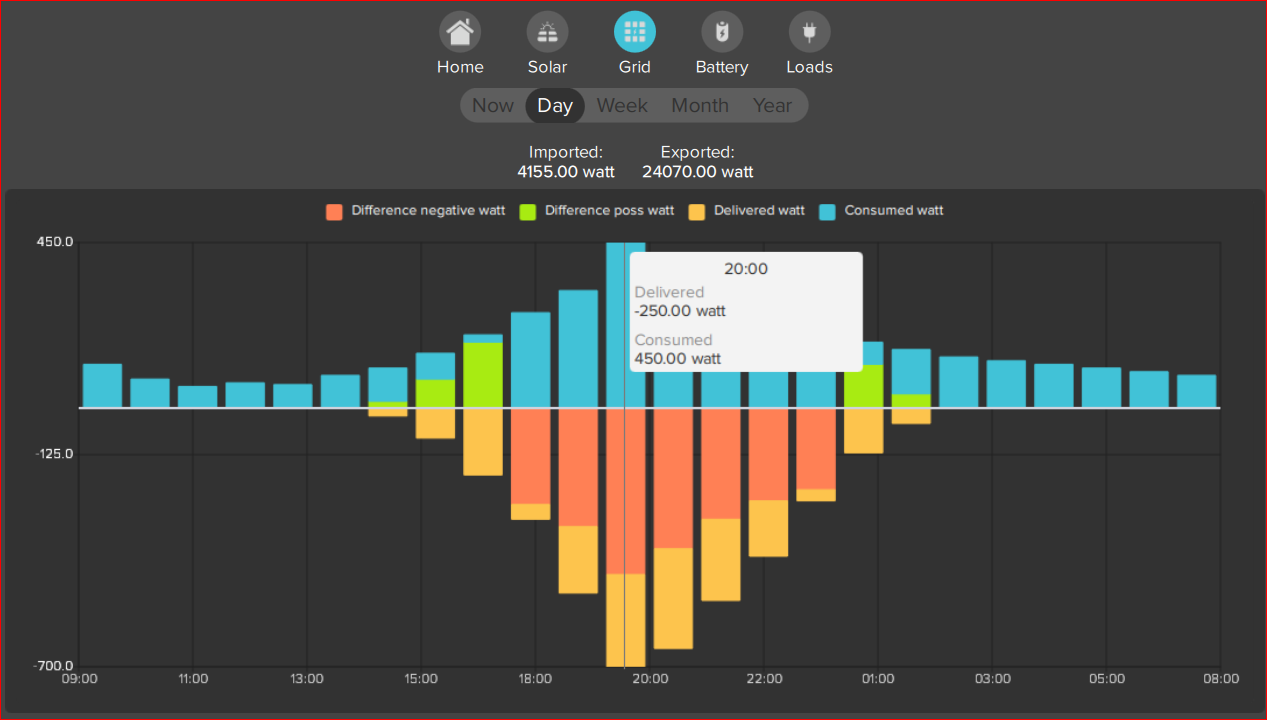
Energy Manager - Grid import and export
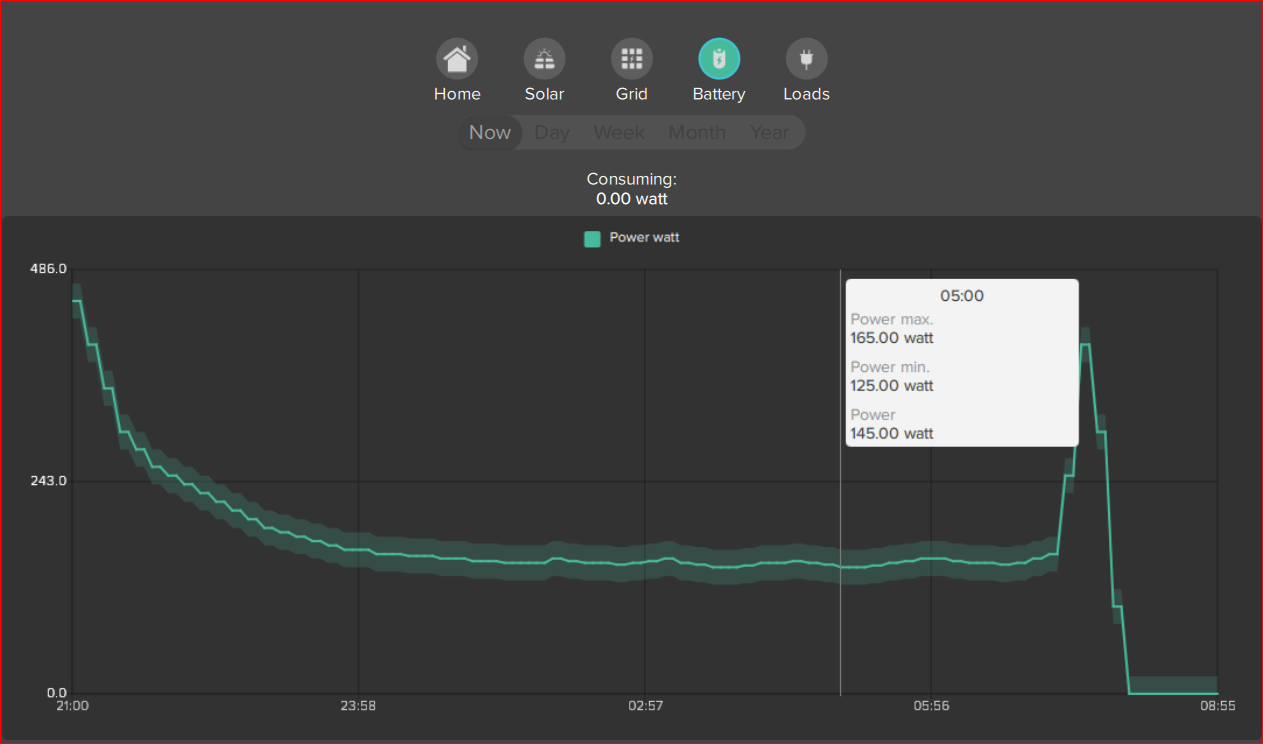
Energy Manager - Battery charge and discharge
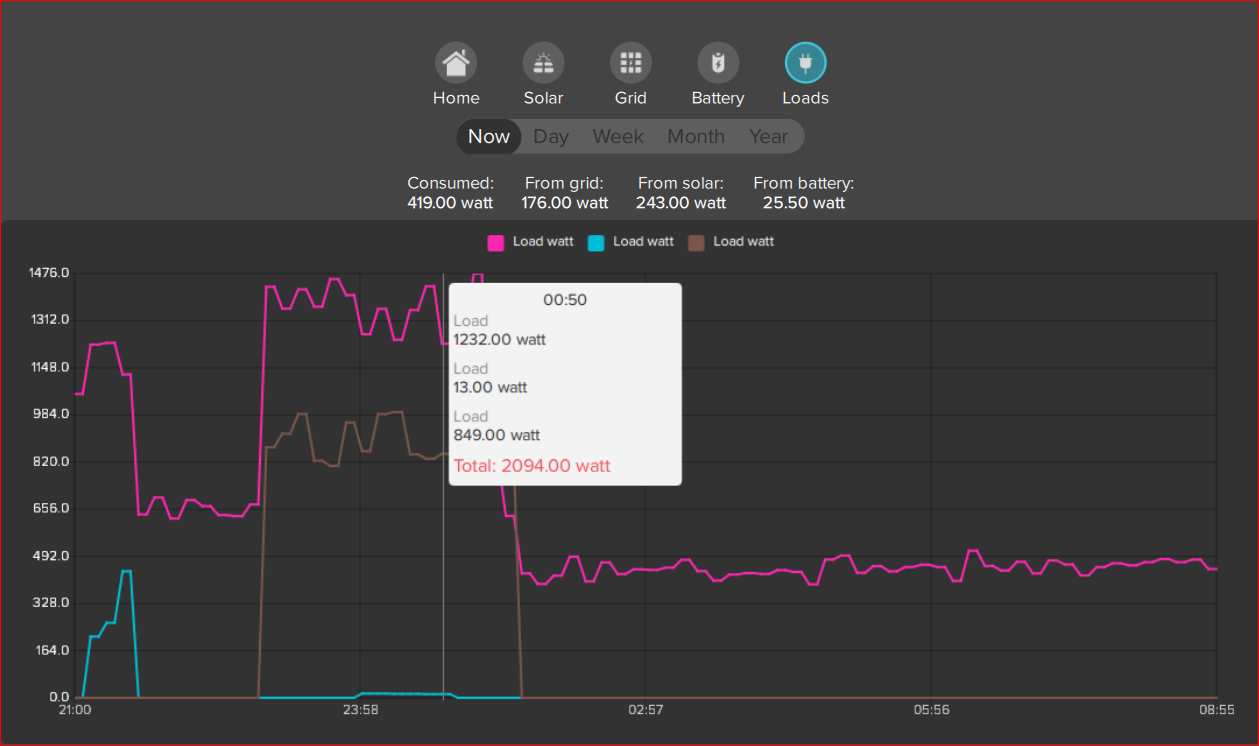
Energy Manager - Loads consumption